15 setups.
Receipts attached.
Every trade the engine would have taken — 3,240 of them across 96 IDX tickers over 3 years — replayed bar-by-bar. Then re-tested on 24 months of out-of-sample data the engine never saw during tuning. No cherry-picked windows. No survivorship-flattering selection. The same 15 setups that fire signals in your inbox today.
Engine v9 · Generated 2026-05-11 WIB · Educational only · Not investment advice
How we tested
Methodology you can audit — not a black box.
Engine state & test framework
Setups doing the work
- 15 battle-tested detectors. Started with 20. Cut 5 that failed OOS. Added 5 that survived independent validation.
- 3-phase chandelier trail. SL → breakeven after TP1, then trails 2×ATR below running high.
- Per-setup MAX_HOLD. Each detector has a hold-window tuned to its character (Stage2-Breakout 90d, Pullback-Uptrend 15d, etc).
- Production-identical replay. Weekly MTF resample + per-bar IHSG regime simulation. Backtest sees nothing the live engine doesn’t.
- Universal SL/TP guards. SL must sit below entry, TP2 must exceed TP1, fallback 2.5R on invalid swing levels.
How we know it’s not curve-fitting
- Plain backtest. Every stock, every bar, 3 years.
- Walkforward. 4 disjoint 6-month windows after 12-month warmup. Trades filtered by entry date — no warmup leakage.
- Data source. yfinance daily snapshots, 2023-05 → 2026-04. Reproducible.
What each setup actually does
15 setups, ranked by trade count. Workhorses top, specialists tail.
| Setup | N | WR% | AvgW | AvgL | Exp% | PF |
|---|---|---|---|---|---|---|
| Pullback-Uptrend | 887 | 53.0 | +15.39 | -5.03 | +5.80 | 3.45 |
| EMA200-Bounce | 607 | 53.5 | +19.67 | -4.74 | +8.33 | 4.78 |
| Pocket-Pivot | 477 | 51.2 | +11.45 | -6.43 | +2.72 | 1.87 |
| Ichimoku-Break | 234 | 60.7 | +14.89 | -4.63 | +7.21 | 4.96 |
| Wyckoff-Spring | 228 | 45.2 | +16.04 | -3.14 | +5.53 | 4.21 |
| Accumulation-Zone | 176 | 62.5 | +14.00 | -4.09 | +7.22 | 5.71 |
| Inside-Bar-Break | 168 | 55.3 | +14.08 | -5.42 | +5.37 | 3.22 |
| VCP | 143 | 51.1 | +11.23 | -4.42 | +3.58 | 2.66 |
| Stage2-Breakout | 129 | 59.7 | +9.10 | -3.88 | +3.86 | 3.47 |
| Donchian-Break | 49 | 61.2 | +14.21 | -6.42 | +6.21 | 3.49 |
| Golden-Cross | 45 | 44.4 | +22.62 | -4.57 | +7.52 | 3.96 |
| 52W-High-Break | 45 | 51.1 | +20.08 | -5.73 | +7.47 | 3.67 |
| HL-Reversal | 24 | 45.8 | +26.34 | -1.23 | +11.41 | 18.18 |
| High-Tight-Flag | 16 | 43.8 | +59.07 | -8.46 | +21.09 | 5.43 |
| Weakness-Recovery | 12 | 41.6 | +10.66 | -1.39 | +3.63 | 5.48 |
Every ticker, every trade
All 96 stocks ranked by 3y return. Top: BUVA +5,048%. Power-law spread is the trend-following fingerprint — most upside in a few trends, no bleed on the rest.
| Code | N | WR% | Exp% | PF | TotRet% (3y) | MaxDD% | Hold | Top Setup |
|---|---|---|---|---|---|---|---|---|
| BUVA | 39 | 61.5 | +14.67 | 6.84 | +5048 | -24.4 | 9.9 | Pullback-Uptrend |
| DEWA | 32 | 62.5 | +13.34 | 7.96 | +3021 | -26.4 | 12.8 | Pullback-Uptrend |
| BULL | 38 | 52.6 | +10.77 | 3.97 | +2033 | -27.5 | 9.1 | Pullback-Uptrend |
| MINA | 24 | 62.5 | +18.06 | 4.88 | +1768 | -39.6 | 10.7 | Pullback-Uptrend |
| BNBR | 12 | 66.7 | +36.91 | 26.10 | +1699 | -8.7 | 8.2 | Pullback-Uptrend |
| HRTA | 29 | 65.5 | +12.28 | 7.08 | +1564 | -16.4 | 12.5 | Pullback-Uptrend |
| VKTR | 27 | 55.6 | +13.55 | 6.33 | +1411 | -34.0 | 10.4 | Wyckoff-Spring |
| ENRG | 32 | 65.6 | +10.69 | 6.21 | +1321 | -17.8 | 8.7 | Pullback-Uptrend |
| TAPG | 25 | 76.0 | +11.57 | 12.79 | +1198 | -9.2 | 17.0 | Pullback-Uptrend |
| PTRO | 34 | 50.0 | +10.03 | 4.31 | +1195 | -37.8 | 11.1 | Pullback-Uptrend |
The hardest test we run
Tuned on month 0–12, tested on 4 independent unseen 6-month windows. CONSISTENT = edge survives all 4. The line between real edge and lucky window.
| Setup | N | Folds | WR% | Exp% | PF | WR± | Exp± | Verdict |
|---|---|---|---|---|---|---|---|---|
| Pullback-Uptrend | 783 | 4 | 53.8 | +5.69 | 3.49 | ±6.3 | ±1.36 | CONSISTENT |
| EMA200-Bounce | 532 | 4 | 57.5 | +7.27 | 4.63 | ±11.9 | ±3.26 | CONSISTENT |
| Pocket-Pivot | 404 | 4 | 50.3 | +1.69 | 1.54 | ±13.0 | ±1.69 | VOLATILE |
| Wyckoff-Spring | 216 | 4 | 52.3 | +5.81 | 5.21 | ±17.8 | ±2.59 | CONSISTENT |
| Ichimoku-Break | 209 | 4 | 56.0 | +6.55 | 4.40 | ±20.2 | ±4.93 | CONSISTENT |
| Accumulation-Zone | 169 | 4 | 62.2 | +5.85 | 4.78 | ±14.1 | ±3.07 | CONSISTENT |
| Inside-Bar-Break | 154 | 4 | 54.5 | +4.11 | 2.67 | ±17.5 | ±5.79 | VOLATILE |
| VCP | 125 | 4 | 48.0 | +4.45 | 3.10 | ±13.2 | ±4.13 | VOLATILE |
| Stage2-Breakout | 102 | 4 | 59.8 | +4.42 | 3.59 | ±20.2 | ±5.30 | VOLATILE |
| Golden-Cross | 61 | 4 | 62.3 | +7.05 | 6.59 | ±4.6 | ±4.01 | CONSISTENT |
| Donchian-Break | 44 | 4 | 68.2 | +7.14 | 4.47 | ±23.6 | ±11.97 | VOLATILE |
| 52W-High-Break | 39 | 4 | 51.3 | +5.80 | 3.12 | ±43.5 | ±8.79 | VOLATILE |
| HL-Reversal | 18 | 4 | 61.1 | +7.50 | ∞ | ±14.5 | ±9.91 | CONSISTENT |
| High-Tight-Flag | 15 | 4 | 60.0 | +26.16 | 11.47 | ±40.8 | ±111.24 | VOLATILE |
| Weakness-Recovery | 12 | 4 | 41.6 | +3.57 | 6.16 | ±57.7 | ±11.03 | VOLATILE |
What the numbers don’t tell you
Anyone who hides limitations is selling you something. Here’s ours.
Full notes on each caveat
- Gross, not net of fees. Real broker fees run ~0.15% each way (~0.30% round-trip). The
/portfoliotracker accounts for them in live tracking; the backtest math here doesn’t. Expectancy on smaller-edge setups drops once fees are in. - yfinance has ~15 min lag. Live entries can differ from backtest entries by 1–2% on fast movers.
- Recent IPOs excluded from walkforward. Tickers like CDIA and FORE don’t have enough warmup history yet. They’ll join the OOS pool once they do.
- Survivorship bias. The watchlist is what exists today. Stocks delisted between 2023–2026 aren’t in the test set.
- Per-stock, not portfolio-level. No correlation modeling, no max concurrent positions, no capital allocation logic. Your account return depends on your sizing decisions.
- One IDX cycle. 3 years is enough to validate short-term edge. Not enough to claim multi-cycle (10y+) robustness.
- Engine v9 snapshot. Numbers match the engine version currently in production. Every engine update triggers a full re-run via
python scripts/generate_backtest_md.py.
Questions you should be asking
Skepticism is a feature. 7 questions, honest answers.
How do you know this isn’t curve-fitting?
We tune the engine on the first 12 months of data, then test it on 4 independent 6-month windows it has never seen. A setup only earns the CONSISTENT label if its edge holds steady across all 4 — fold-to-fold variance smaller than mean expectancy.
Curve-fitted edges fail this test. They look great on the data they were tuned on, then collapse the moment the regime shifts. 7 of our 15 setups passed. The other 8 are still positive in aggregate but lumpy across windows — we keep them running with smaller position sizing and call them VOLATILE in §4. No hiding.
Why only 7 of 15 setups CONSISTENT?
No. VOLATILE means “positive expectancy overall, but lumpy fold-to-fold” — the edge is real, it just doesn’t arrive on a predictable schedule. Look at the walkforward table: every VOLATILE setup still has positive aggregate expectancy and PF > 1.
We sized these setups smaller in production and treat their signals as opportunistic rather than core. The strict labeling exists so you know what you’re buying beforethe trade, not after. Most retail signal services would call these “our top performers.” We call them what they are.
What about bear markets or major regime changes?
The engine reads IHSG regime on every bar and adjusts setup weights and quality thresholds accordingly. In the tested window (2023–2026) IHSG had two distinct drawdown phases (Q3 2023, Q1 2024) — signal frequency dropped automatically during both.
Honest take: trend-following systems underperform in chop.You should expect lower returns during prolonged sideways or bear markets. The system shouldn’t blow up, but it won’t print money in a 70%-of-the-year sideways grind. We have 3 years of data — not enough to claim multi-cycle robustness. We’d be lying if we did.
Will my real account match these numbers?
No, and you shouldn’t expect them to.The backtest is gross of fees (real round-trip is ~0.30%), assumes you take every signal (you won’t — you’ll skip some, miss some, hesitate on others), and doesn’t model partial fills or slippage.
Realistic adjustment: shave ~5–10% off per-setup expectancyfor fees + slippage. The workhorse setups (Pullback-Uptrend, EMA200-Bounce, Ichimoku-Break, etc.) still print after that haircut. The marginal setups don’t. That’s your filter.
What’s the worst case I should plan for?
Per-trade worst case: a single position going against entry hard enough to hit MaxDD before SL triggers. We’ve seen −57% on LEADas the deepest single-position drawdown. That’s the depth, not the loss — SL caught it eventually.
Portfolio-level: depends entirely on your sizing. Size every signal so a single −50% per-position drawdown wouldn’t break you.The engine doesn’t model your portfolio for you — that’s your judgment call, and the most important one.
Can I try the signals before subscribing?
Yes. The free plan delivers 3 signals/day from the same engine and the same 15 setups you just audited. No credit card. No trial period. No expiry.
Paper-trade them for as long as you want before deciding whether to upgrade. The expectancy on these signals is in §2 of this page — you already know what to expect before you start.
What if my position hits ARA / ARB?
The engine sees end-of-day bars. If a stock hits ARB (auto-reject bawah) mid-session, you physically can’t exit at SL until next session — that’s an IDX rule, not an engine choice. The backtest mirrors this: it executes at EOD only.
In other words, the backtest already accounts for the ARA/ARB constraint by default. The number you see in §3 includes trades where SL was breached intraday but execution happened at the next-day open. It’s not a hidden risk — it’s baked into the math.
Two signals we shipped
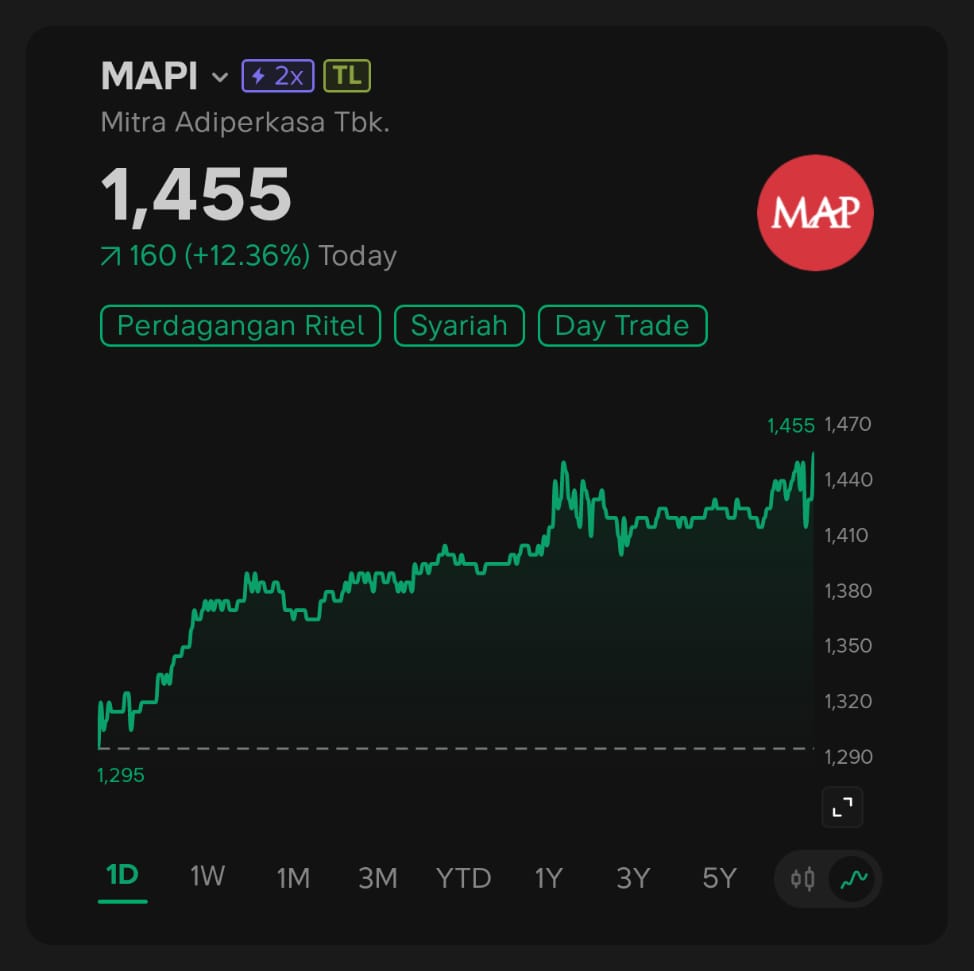
Same engine, two delivery modes — the auto-broadcast that lands in subscribers’ DMs, and the manual /signal query a user types in chat.
- Entry: Rp 1.295
- SL: Rp 1.217(-6.02%)
- TP1: Rp 1.451(+12.0%)
- R:R 1:2.0
- Holding: 8–25 hari
- Entry Rp 342
- TP1 Rp 384(+12.28%)
- TP2 Rp 448(+30.99%)
- SL Rp 321(-6.14%)
- R:R 1:2.0
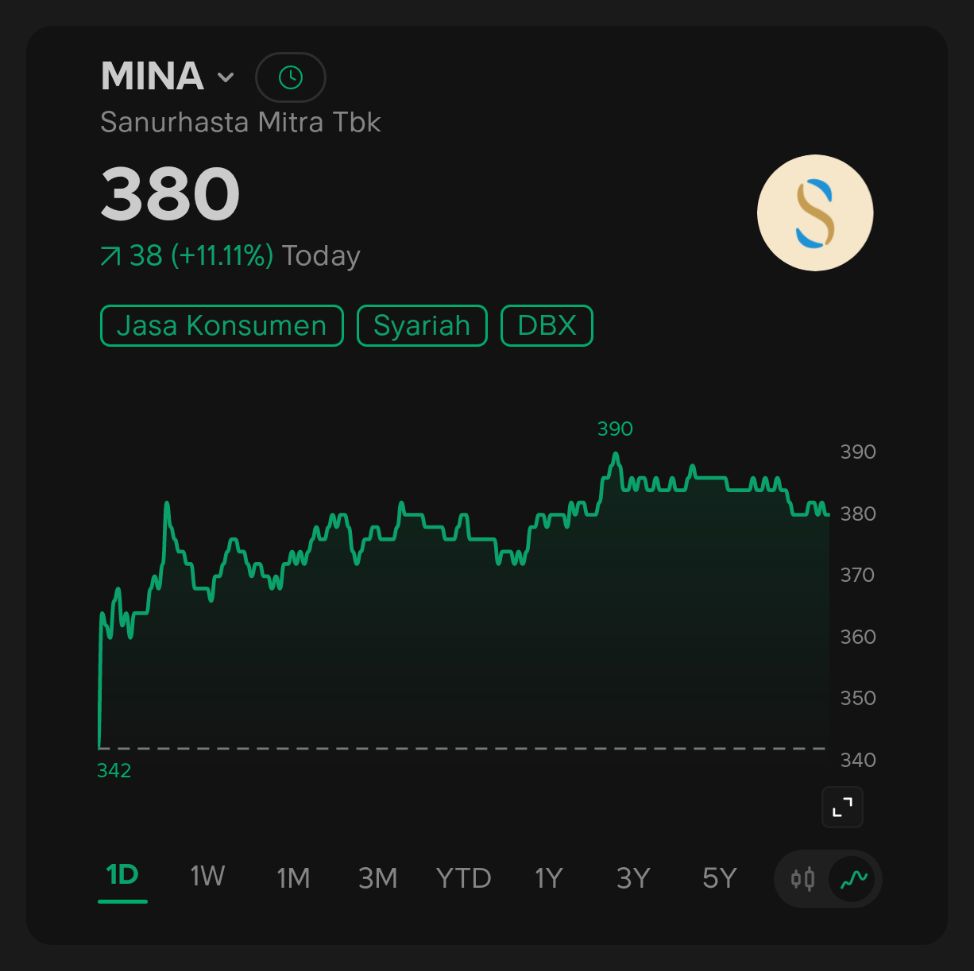
/signal MINA. Engine returns STRONG BUY at Rp 342, confluence 79/100, setup Golden Cross Fresh Q87 — flagged with high-volatility + counter-trend warnings.Two signals, two delivery modes — same engine, same Entry/SL/TP discipline. Notice the MINA query also surfaced two honest risk warnings before the trade: high volatility (ATR 9.5%) and counter-trend (IHSG Bear). The engine labels risk transparently, before you click buy.
The 15 setups above are firing right now.
Every time one triggers on an IDX ticker, you get the alert — with entry, stop, and take-profit already calculated. Same logic, same engine, same numbers you just audited. Three signals per day on the free plan. No credit card, no trial period, no catch.